Smart Standard Deviation Calculator - Calculate Standard Deviation with Precision
Our advanced tool helps you analyze data variability quickly and accurately. Get instant results with detailed explanations and visual representations to better understand your dataset's distribution.
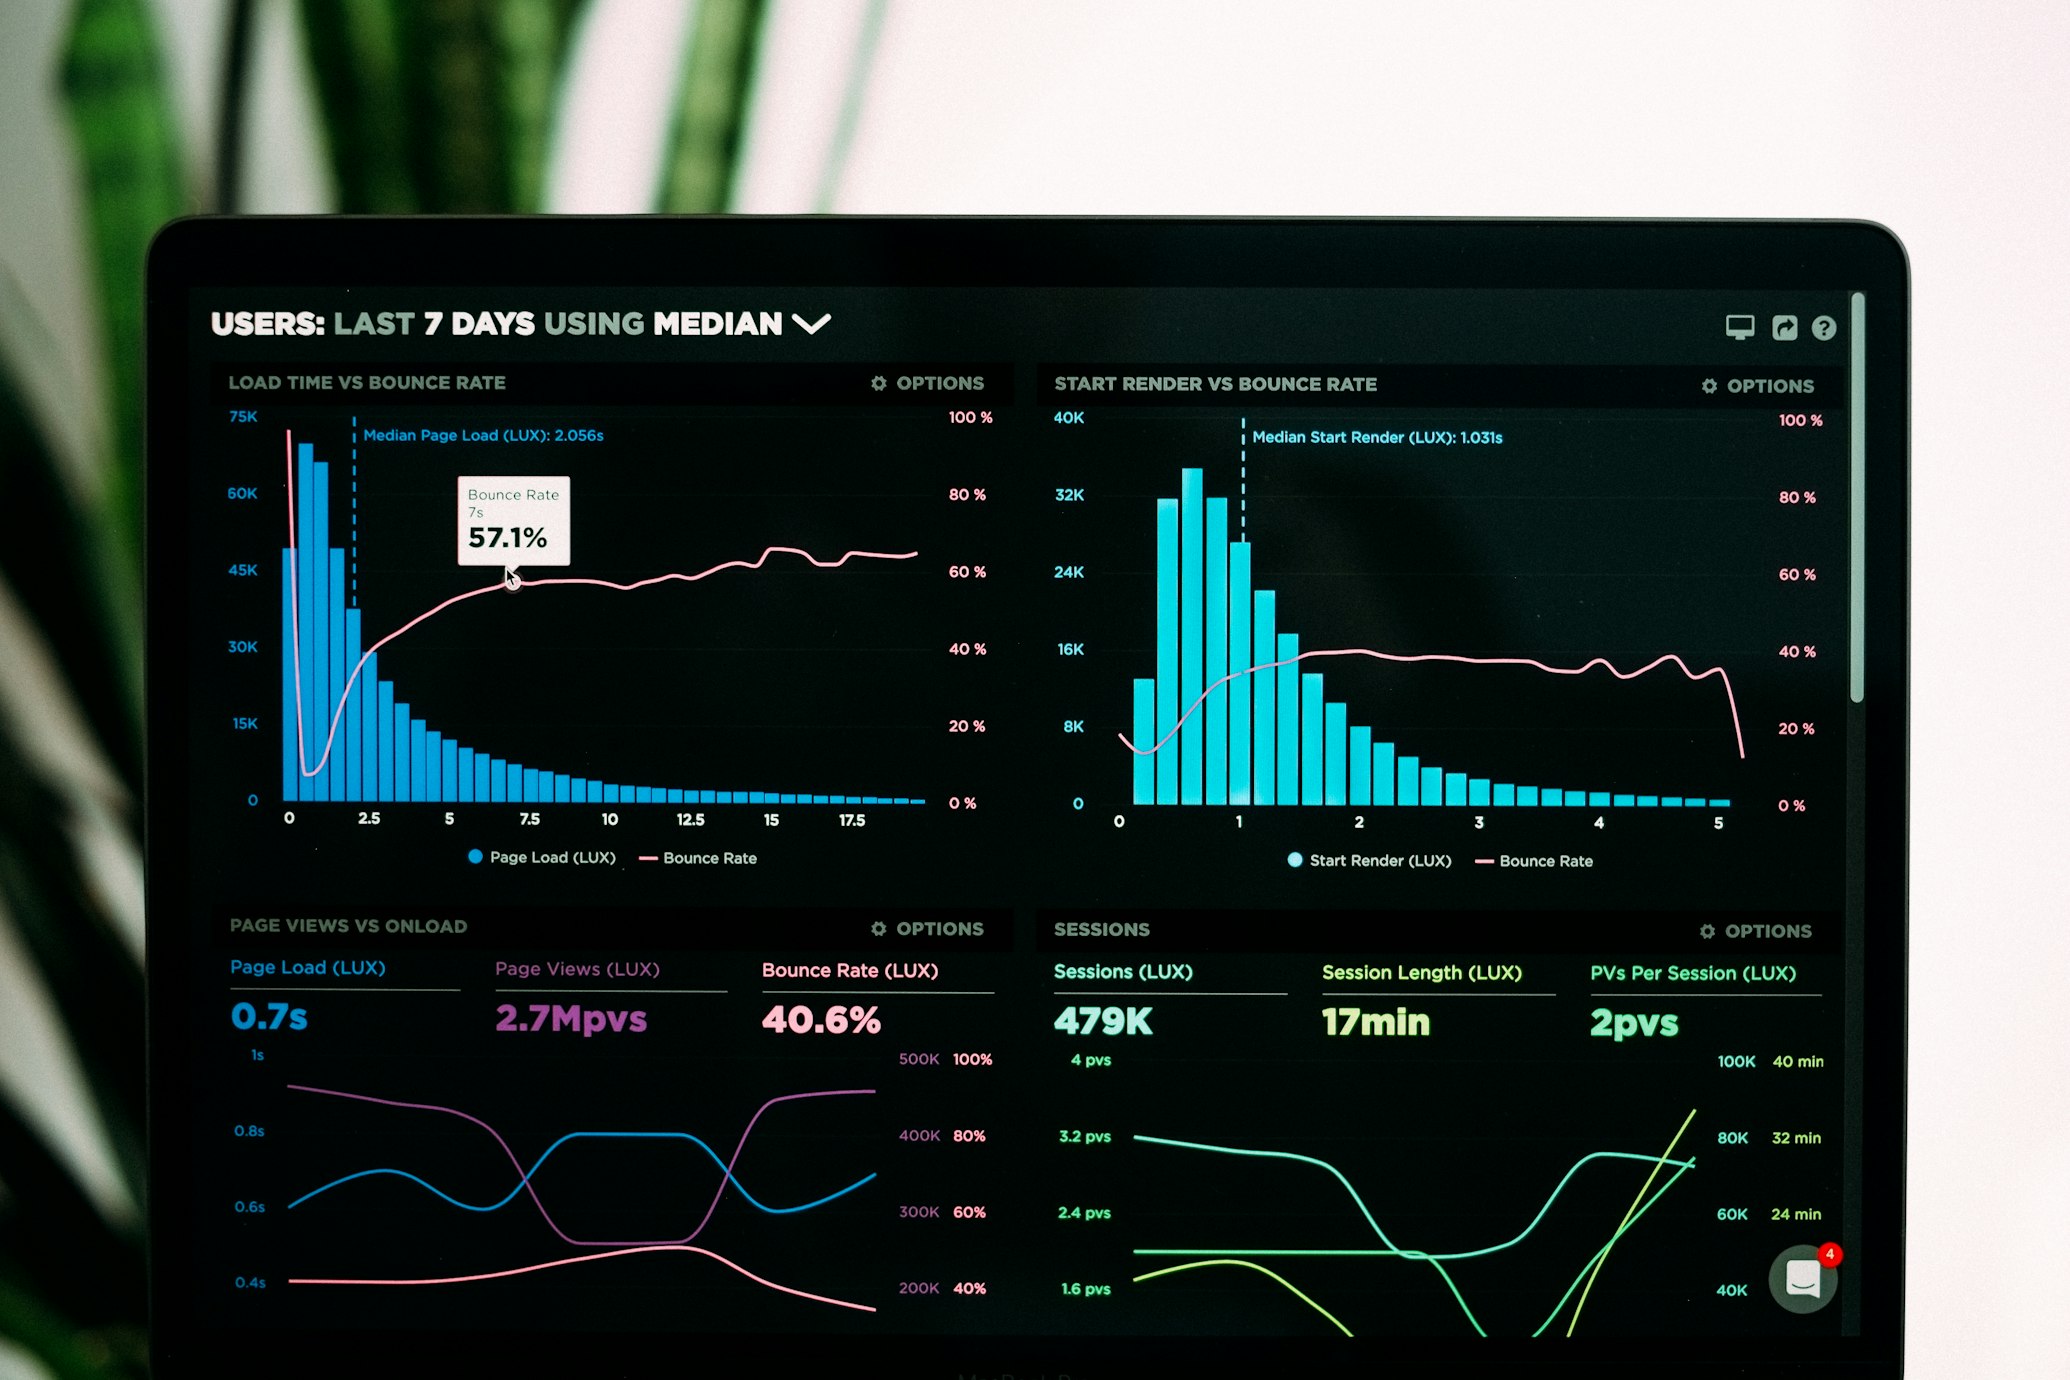
Visualizing data distribution and variability
Data Visualization
Enter data to see visualization
Calculation Results
Standard Deviation
-
Variance
-
Mean
-
Data Points
-
How to Use the Standard Deviation Calculator

Using our tool to analyze data distribution patterns
- Enter your data: Input your numerical values separated by commas in the provided field.
- Select data type: Choose whether your data represents a sample or an entire population.
- Calculate: Click the "Calculate Standard Deviation" button to process your data.
- Review results: Examine the standard deviation, variance, mean, and data visualization.
- Interpret findings: Use the provided insights to understand your data's variability.
What is Standard Deviation?
Understanding data spread and distribution patterns
Standard deviation calculator is a fundamental statistical measure that quantifies the amount of variation or dispersion in a set of data values. A low standard deviation indicates that data points tend to be close to the mean (average) of the set, while a high standard deviation indicates that data points are spread out over a wider range of values.
TStandard Deviation Calculator is essential for researchers, students, and professionals who need to analyze data variability quickly and accurately. Our calculator simplifies complex statistical calculations, providing instant results with detailed explanations. Using a reliable tool ensures precision in your statistical analysis, helping you make informed decisions based on your data.
When working with datasets, understanding dispersion is crucial for interpreting results correctly. The standard Deviation calculator automatically computes both sample and population standard deviation, saving you time and reducing calculation errors. This advanced standard deviation calculator also provides visual representations of your data distribution, making it easier to comprehend the spread of values around the mean.

Results with data visualization and statistical insights
The Standard Deviation Calculator is particularly valuable in fields like finance, research, quality control, and education. Financial analysts use it to assess investment risk, while researchers rely on it to validate their experimental results. A properly functioning tool helps identify outliers and understand data consistency.
Modern statistical tools like this one go beyond basic calculations. They provide additional metrics like variance, mean, and data count, along with graphical representations. This comprehensive calculator also offers interpretation guidance, helping users understand what their calculated standard deviation means in practical terms.
Whether you're a student learning statistics or a professional analyzing business metrics, this tool streamlines your workflow. The intuitive interface makes statistical analysis accessible to users at all skill levels. With just a few clicks, it transforms raw data into meaningful insights about variability and distribution.
The accuracy of any statistical calculator depends on proper data input and correct selection of sample versus population calculation. This tool automatically handles the mathematical nuances, ensuring you get precise results every time. Using a reliable calculator eliminates manual calculation errors and provides consistent, verifiable outcomes for your statistical analysis needs.
Related Calculators
For more in-depth information about statistical concepts and their applications, visit the Investopedia guide on standard deviation calculator, which provides comprehensive explanations with practical examples from various fields.
Standard Deviation Formula
Mathematical formulas for population and sample calculations

Mathematical formulas and calculation methods
Population Standard Deviation Formula
σ = √[ Σ(xi - μ)² / N ]Where:
σ = Population standard deviation
Σ = Sum of...
xi = Each value from the population
μ = Population mean
N = Number of values in the population
Sample Standard Deviation Formula
s = √[ Σ(xi - x̄)² / (n - 1) ]Where:
s = Sample standard deviation
Σ = Sum of...
xi = Each value from the sample
x̄ = Sample mean
n = Number of values in the sample
Example Calculation
Let's calculate the standard deviation for this dataset: [5, 10, 15, 20, 25]
- Calculate the mean: (5+10+15+20+25)/5 = 15
- Find the squared differences from the mean:
(5-15)² = 100, (10-15)² = 25, (15-15)² = 0, (20-15)² = 25, (25-15)² = 100 - Sum the squared differences: 100+25+0+25+100 = 250
- Divide by N (for population) or n-1 (for sample):
Population: 250/5 = 50
Sample: 250/(5-1) = 62.5 - Take the square root:
Population: √50 ≈ 7.07
Sample: √62.5 ≈ 7.91
Frequently Asked Questions

Frequently asked questions and answers
What is the difference between population and sample standard deviation?
Population standard deviation calculator(σ) is used when your data represents the entire population you're studying. Sample standard deviation (s) is used when your data is only a sample of a larger population. The key difference is in the denominator of the formula: population uses N (total number of values) while sample uses n-1 (number of values minus one), which corrects for bias in the estimation.
When should I use standard deviation?
Standard deviation calculator is useful in many scenarios: assessing investment risk in finance, evaluating consistency in manufacturing processes, analyzing experimental results in research, comparing performance across different groups, and identifying outliers in datasets. It's particularly valuable when you need to understand how spread out your data points are from the average value.
What does a high standard deviation indicate?
A high standard deviation indicates that data points are spread out over a wider range of values, suggesting greater variability in the dataset. This could mean less consistency, higher risk (in financial contexts), or more diversity in the measured characteristic. Conversely, a low standard deviation suggests data points are clustered closely around the mean.
Can standard deviation be negative?
No, standard deviation cannot be negative. Since it's derived from squared differences (which are always positive) and then taking a square root, the result is always zero or positive. A standard deviation of zero indicates all values in the dataset are identical.
How is standard deviation related to variance?
Variance is the average of the squared differences from the mean, while standard deviation is the square root of the variance. Standard deviation is more commonly used because it's in the same units as the original data, making it easier to interpret. Variance is expressed in squared units, which can be less intuitive.
Related Calculators
Circumference Calculator
Calculate the circumference of circles given radius or diameter.
Use CalculatorSignificant Figure Calculator
Determine the significant figures in numbers and calculations.
Use Calculator